| Patterns of butterfly, bird and tree diversity in the Western Ghats |
Krushnamegh Kunte*, Ajit Joglekar†, Ghate Utkarsh§,** and P. Pramod‡
*Swarmangal, 4024, Survey No. 14/4, Warje, Pune 411 029, India
†
263/4, ‘Jalshakti’, Sinhagad Road, Pune 411 036, India§
Centre for Ecological Sciences, Indian Institute of Science, Bangalore 560 012, India‡
Biodiversity Unit, Jawaharlal Nehru Centre for Advanced and Scientific Research, Jakkur, Bangalore 560 064, IndiaWe censused butterfly assemblages of the Western Ghats of India in 15 localities and 8 vegetation types during 67 transects, each 600 m long, and traversed in one hour. The natural vegetation types had relatively high diversities compared to human impacted vegetation types such as scrub/savanna and grasslands. The home gardens and paddy fields had very distinctive species composition, coupled with very low levels of beta diversity. Their constituent species were more widespread. Comparison of these patterns with those found amongst trees and birds reported in similar studies threw up interesting parallels as well as contrasts. Species dissimilarity in evergreen vegetation types were high for trees and butterflies, but low for birds. Bird and butterfly assemblages in monoculture tree plantations had low species richness, less distinctiveness and high levels of dissimilarity, being comprised of rather widespread species. However, on the whole there was little relation between taxonomic groups and vegetation types across diversity parameters. There could be important implications of these patterns of diversity dispersion and their co-variation across taxonomic groups for assigning conservation priorities. We emphasize the need for classifying the landscape, both natural and manmade, on the basis of structural vegetation types, followed by stratified sampling of multiple groups of organisms for monitoring the status of and designing conservation strategy for biodiversity.
IN recent years, the focus of nature conservation efforts has become more inclusive, broadening from an approach emphasizing flagship species like cranes, sea turtles or tiger to embrace the entire diversity of life. Thus, biological diversity is now increasingly recognized as a vital parameter to assess global and local environmental changes and sustainability of developmental activities1. As one of the world’s top twelve megadiversity countries, and a signatory to the international Convention on Biological Diversity (CBD) it is important for India to try and conserve the entire spectrum of biological diversity and to institute an ongoing programme of monitoring the efficacy of conservation measures2.The efforts needed for inventorying and monitoring are enormous in magnitude. India harbours over 1,25,000 scientifically described and perhaps another 400,000 undescribed species, over its 320 million ha of landmass and 200 million ha of exclusive economic zone3. Conservation strategies must therefore be developed to maintain diversity levels in the entire range of natural as well as managed ecosystems. This calls for extensive information, ideally on all groups of plants, animals and micro-organisms across India's landscape and waterscape. Conservation priorities should be decided on the basis of such information, and conservation measures decided upon to translate these priorities into action4. The efficacy of the conservation measures thus instituted would then have to be monitored on a periodic basis to continually adjust the conservation actions to changing ground realities5. Obviously this is a task that cannot be accomplished in its entirety; we must therefore resort to sampling. Such sampling should be attempted along three axes: sampling a subset of taxa; sampling in certain localities; and repeated assessments at certain time intervals6,7. It must be clarified that this is to design a programme of monitoring; side by side taxonomic inventorying of the entire spectrum of diversity has to be continued.
Such a monitoring programme must be designed on the basis of an understanding of the diversity dispersion over space and time in different groups of organisms. We have a broad understanding of such patterns over the Western Ghats biogeographic province8. Very little is known about the diversity dispersion across different vegetation types that constitute an intricate mosaic in this hill region. Even in the United Kingdom where butterfly populations are being monitored for more than two decades, understanding of the effect of compositional changes in habitats on butterfly community structure and dynamics is far from being complete9. Since major habitat transformation is a significant factor underlying erosion of diversity, it is important to understand the patterns of diversity of various taxonomic groups across different vegetation types10. Of course, habitats are defined from the perspective of the organisms. Habitats for birds are evidently different from those for earthworms or rotting fungi11. However, it is necessary to employ a standard system of classification of habitats to organize a comprehensive programme of monitoring biodiversity. For this purpose it is appropriate to focus on the dominant growth forms of plants and to characterize habitats as vegetation types12.
It is with this background that the Western Ghats Biodiversity Network (WGBN) has organized a programme of sampling species level diversity in a number of taxa in a series of 20 localities distributed over the length of the Western Ghats. Each locality is viewed as a mosaic of several terrestrial vegetation types and a variety of freshwater habitats. WGBN has then undertaken sampling of flowering plants, bryophytes, birds, butterflies, ants, aquatic insects, freshwater mollusks, fish and caecilians in representative landscape element types13. In this paper we discuss the results of our studies through WGBN on butterfly communities and diversity, and compare the patterns discerned with those for birds and trees published previously12,14.
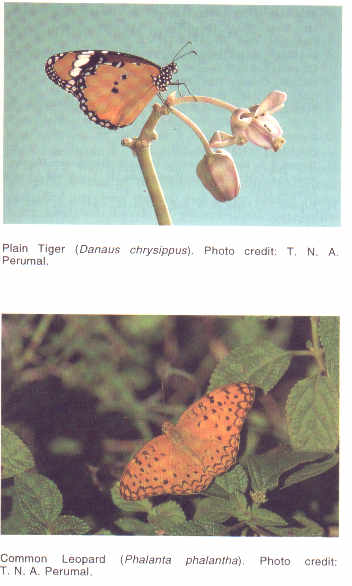
In terms of indicator organisms for biodiversity studies15, butterflies are an excellent choice. They are common almost everywhere, attractive and easy to observe. Many species, both common and rare, can be easily and reliably identified in the field, without killing. They are also amongst the better-studied groups of organisms, with availability of field guides. Further, their diversity and community composition are dependent on that of plants, as their caterpillars have strict dependence on specific host plants. As they undergo metamorphosis, ecologically they contribute more to local diversity because of their dual fundamental role than monomorphic organisms. Therefore, they should be given more prominence in diversity studies. India has a butterfly fauna comprising of 1501 species of which the Western Ghats harbours 330 species including 37 endemic species and another 23 shared only with Sri Lanka16. These 330 species belong to 166 genera and 5 families.
Materials and methods
The Western Ghats is a 1600 km long mountain range, with a variable breadth of 5 to 25 km, lying parallel to the western coast of India. In elevation it rises up to 2800 m. The present study was based on 67 line transects from 14 localities in elevations below 1200 m. The landscape of each of the 14 localities was a mosaic of different vegetation types. We sampled the butterflies by walking on line transects that traversed through homogeneous vegetation types. The transects were assigned to the eight vegetation types on the basis of structure and phenology of the vegetation, the rationale for which was discussed at length in Utkarsh et al.12. The 5 natural vegetation types mentioned here broadly correspond to the classification followed by Indian foresters17, the French institute at Pandichery18 and UNESCO19. The typology followed in this study is briefly described below:
Evergreen forests: These harbour 20–30 m tall trees, with a dense canopy covering over 80% of the ground. More than 80% of the trees are evergreen species. Here, we have recomputed the tree diversity parameters by pooling three closely related evergreen vegetation types described in Utkarsh et al.12 to achieve compatibility for the purpose of comparison12.
Semi-evergreen forests: These harbour 15–25 m tall trees with 40–80% evergreen species, having 60–80% canopy cover.
Deciduous forests: These have 10–20 m tall trees, closed but not with a very dense canopy covering 40–70% of the ground. About 0–40% trees are evergreen. The deciduous forests referred here mainly correspond to moist deciduous forests, and not the dry ones.
Scrub/savanna: These are non-forest formations with shrubby or grassy undergrowth and a scattered tree canopy (0–40%). Trees, if present, are 5–15 m tall. Proportion of evergreen trees varies from place to place, but generally the deciduous trees predominate.
Grasslands: These are devoid of trees, and abound in grasses, sedges and other herbaceous flora during the monsoon – postmonsoon period. Occasionally, shrubs may be present.
Monoculture plantations: These comprise of orchards or forestry plantations. The orchards we surveyed consisted of evergreen trees with a shady canopy such as arecanut, coconut or semi-evergreen canopy like rubber. The forestry plantations were made up of evergreen trees like Ailanthus, mahogany, or deciduous trees like teak. A given patch usually comprises of a single species but there may be regeneration of natural trees, varying in degree and composition from place to place. Canopy cover in plantations surveyed was high-ranging from 60 to 95%. Tree heights were uniform within and variable across plantations.
Home Gardens: These harbour a heterogeneous vegetation structure in terms of canopy cover (40–90%), evergreenness (40–80%) and tree heights.
Paddy fields: The fields harbour indigenous and naturalized herbaceous species along the bunds, which spread all over the field after the paddy crop is harvested.
The butterflies were censused along 600 m long transects, traversed in one hour. Transects were enumerated between 8.00 and 11.00 h in the morning, when butterfly activity was usually at its daily peak. The sampling was conducted during May and September–October 1995. The species were identified on the basis of field characters20,21. A total of 3294 individuals were assigned to 133 species. 267 individuals could not be identified to species level. Since these belonged to more than one genus and formed a small fraction (7.5%) of the total individuals recorded (3561) these have not been included in the present analysis. Each vegetation type was sampled in localities scattered all over the Western Ghats, except monoculture plantations and home gardens, which were sampled only in the southern half of the Ghats, i.e. 13°N southwards, where they were plentiful. Details of distribution of transects in habitat types, localities and latitudinal zones, are provided in Table 1.
This sampling scheme had certain limitations. The evergreen forests are supposedly very rich in butterflies, many of which fly high in the canopy, and some are specialized to this stratum (Harish Gaokar, pers. commun.). These could not be sampled, leading to underestimation of abundance and perhaps also the diversity of evergreen forest assemblages. The other types such as deciduous forests, scrub or home gardens did not have a high and dense canopy that could obscure the sighting of butterflies. Further, seasonal replicates in all vegetation types in all localities would have been desirable, but could not be accomplished due to logistic constraints. Hence, sampling was confined to the peak season of butterfly abundance. Each transect in a locality was traversed only once. The number of transects taken per vegetation type varied (Table 1). The distribution of sampling transects per vegetation type or locality broadly reflects the frequency of occurrence of these vegetation types among the study sites, but does not follow a systematic design. Hence, the patterns described here are exploratory in nature.
Our basic data then consisted of the abundance of 133 species along 67 transects belonging to 8 vegetation types in 15 localities. The number of butterflies per transect varied between 3 and 129 individuals with a mean of 51 and the number of species from 3 to 30 with a mean of 15. We employed these data to compute various diversity parameters as follows.
(a) a -diversity of species encountered in a given sample may be measured simply as species richness, or in terms of indices such as Shannon–Weaver or Simpson’s index. We find that the values of such possible indices are very strongly correlated to species richness14 and therefore stick to the simpler measure in subsequent discussion. However, the number of species on a transect was strongly influenced by the number of individuals sampled (r = 0.56, p < 0.01) which varied from 9 to 129. We corrected for this variation by rarefaction, through the average number of species amongst 9 consecutive individuals22.
(b) b -diversity is related to the unshared species while comparing two sets of species samples. We measured b -diversity as dissimilarity of species composition, djk, amongst two samples j and k. It is defined in terms of the chord distance, which reflects the relative difference between two transects as projected on to a circle of unit radius22.
where xij and xik are the numbers of individuals of species i in transects j and k, respectively, and S is the total number of species encountered over the two transects j and k.
(c) We specify this dissimilarity in two ways, for all pairs of transects assigned to a given vegetation type, and for all pairs in comparing transects assigned to two different vegetation types. If the assignment of transects on the basis of vegetation structure–phenology is accompanied by occurrence of a characteristic set of species then across type levels of dissimilarity should be greater than those within types. We characterise this through the ratio of mean dissimilarity of a type for all pairs across types to mean dissimilarity of all pairs within a given type. This ratio has been termed as the distinctiveness of a given type.
(d) Individuals of a given species may occur on several of the transects sampled. A particular set of species encountered on a given transect may then be characterized in terms of the mean proportion of transects on which members of the set are encountered. If the study involves n transects, then the lowest value this index would take is 1/n. To facilitate comparison amongst studies involving different numbers of assemblages sampled, we suggest an index called ubiquity, and define it as
where pi is the ubiquity for transect i, fij is the proportion of the total number of transects, n, over which a species j present on the transect i is encountered, and mi is the total number of species encountered on transect i. Ubiquity will then vary between 0 and 1; a value of 0 implying none of the species encountered on that transect were encountered elsewhere; a value of 1 implying that all the species encountered on a given transect were found on all other transects. The lower the value of ubiquity then the more restricted in distribution is the set of species found on a given transect. The index of ubiquity used here was first demonstrated by Pramod et al.14. Then, it was simply expressed in terms of the number of transects. Utkarsh et al.12 used the term ‘prevalence’ for the same, but after normalizing it over the sampling effort, as in this paper, so that samples across taxonomic groups or different studies could be compared efficiently.
(e) We use the term cohesiveness to characterize the extent of cohesion of species in any particular assemblage. We compute it in relation to the affinity, i.e. departure of the mean of overlap for all pairs of species in that assemblage, from the overlap expected on the basis of chance alone. The overlap Aij between any pair of species may be computed as:
Aij = Tij/( Ti + Tj – Tij) ,
where Tij is the number of transects over which i and j occur together, and Ti, Tj are the number of transects over which species i and j occur, respectively. Thus, computed overlap is dependent on sampling effort, being underestimated by low levels of sampling. The value of overlap expected by chance alone, Cij = pipj/(pi + pj –pipj); where Pi = Ti/T and Pj = Tj/T; T being the total number of transects. The departure of the overlap from that expected on the basis of chance is therefore Aij – Cij. This correction renders the overlap measure independent of level of sampling effort. The expected value of this quantity, affinity, is 0 if the probability of occurrence of species i on any transect is independent of the probability of occurrence of species j on that transect. If there is a positive tendency for the two species to occur together, then Aij will take a positive value between 0 and 1; if the occurrence of i implies a lower than random chance of the presence of j, then it will take a negative value between 0 and 1. It should be noted that the second term correcting for expected co-occurrence on the basis of chance alone would have a high value if both species are widespread, and a low value if both are rare. Cohesiveness is then defined as:
where n is the total number of species present on the transect. It would then take a low value if the constituent species have a high degree of affinity amongst themselves, constituting a cohesive set of species. It will take a high value if the constituent species are derived as if by chance from many different assemblages, and have little affinity for each other. Cohesiveness is opposite of the hospitality index coined by Pramod et al.14 to assess diversity of species assemblages.
These two indices, ubiquity and cohesiveness attempt to capture properties relating to diversity at the level of sets of species assemblages, namely, how widespread and cohesive are the species constituting the assemblages. This goes beyond the normal measures of diversity such as species richness characterizing single assemblages. Cohesiveness is not a trivial consequence of diversity, but an independent property negatively correlated to ubiquity. It is useful to examine whether the cohesiveness of the observed data differs significantly from those of simulated random assemblages. We have done so on the basis of three kinds of simulations:
- All 133 species have an equal chance of occurring on any of the transects, with the total number of species per transects fixed between 3 and 129, with 10 simulations of each level of species richness.
- One hundred simulations setting the distribution of species richness per transect as observed.
- One hundred simulations setting the distribution of ubiquity per species as observed.
It turns out that the observed range as well as standard deviation of cohesiveness is significantly different from that of random assemblages created in any of these three ways. The observed mean is higher than in simulated assemblages, implying that real life butterfly assemblages do exhibit a measure of cohesion. Furthermore, the standard deviation of cohesiveness in observed assemblages is significantly greater, implying that the variation in extent of cohesion, is of real ecological significance. We also carried out one further check, namely, deleting the species which occur on only one or two transects. It turns out that the computed cohesiveness values do not differ significantly from those computed by retaining the whole species set.
Unlike species diversity or evenness, cohesiveness has no meaning as a property of single assemblages. Instead, it depends on the distribution of butterfly species over a number of assemblages. It is then necessary to check the minimum number of assemblages for which the value of cohesiveness stabilizes. To do so we computed mean cohesiveness for different numbers of assemblages for assemblages drawn randomly from the pool of observed assemblages. It is seen that the value of cohesiveness quickly rises up to 15 transects and reaches an asymptote around 50 transects. With a sample of 67 assemblages, we are above this limit.
(f) To provide an idea of characteristic and commoner species of various vegetation types we present a matrix (Table 2) depicting occurrence of selected species in various vegetation types. For this purpose, the percentage of transects of each vegetation type on which a given species is recorded was computed. This matrix was subjected to reciprocal averaging type of ordination23 and scores for species and sites on the first axis were used for further analysis. The species were grouped into those confined to a single vegetation type, shared between two, three and so on up to all the eight types. From each of these eight groups of species, eight species were chosen such that each had its peak frequency of occurrence in a different type. Of course, there were fewer than 8 species that occurred in 6 or 7 or 8 types. Thus from 8 groups of species based on frequency of vegetation types inhabited, a total of 51, and not 64, species could be selected such that each vegetation type was represented by most frequent species from each of the 8 groups. These 51 species and the vegetation types were sorted on the basis of their reciprocal averaging scores.
(g) Our interest also lies in understanding the patterns of covariation of diversity across various taxonomic groups. We had computed similar indices of diversity for bird14 and tree12 communities, sampled in nearby areas. The bird and tree surveys cover all but one of the 15 localities where butterflies were sampled. However, bird and tree data from some other neighbouring localities have also been used here, as our focus is more on characterizing habitat types than the localities. A total of 9987 birds belonging to 212 species were sampled using 132 belt transects on an average 550 ´ 100 m in size, representing 21 localities and 8 different vegetation types. A total of 20,785 trees belonging to 398 species were recorded from 108 transects on an average measuring 400 ´ 20 m from 30 localities and 4 vegetation types. All the tree transects belong to natural vegetation, although with varying levels of human impact. Since the vegetation classification schemes for the three taxonomic groups are compatible and most of the sampling localities are the same; we compare average per transect values for various diversity parameters across taxonomic groups and vegetation types. For this purpose, we normalize the values for a given taxonomic group on a given diversity parameter on a 0 to 100 scale.
Results and discussions
Patterns of butterfly diversity
Table 3 summarizes the diversity parameters for butterflies, as well as for trees and birds discussed in two earlier papers12,14. Table 2 provides a glimpse of occurrence of the common and characteristic species of the various vegetation types. The butterfly species richness levels as computed on basis the of rarefaction, were relatively higher for the natural forests which harboured a diversity of tree species, although we had not sampled the manmade habitats for tree diversity estimates (Table 3). The butterfly densities were highest in the deciduous forests. Although they appeared rather low in the evergreen and semievergreen forests, those may be underestimates due to under representation of butterflies flying higher up in the canopy. Natural vegetation types also had high beta diversity but moderate to low species ubiquity. Although these natural types harboured many localized and some widespread species, generalist species had invaded along paths and canopy openings. The forests exhibited low to moderate levels of cohesiveness. The distinctiveness of the species composition of the semievergreen forests communities was low, only next to scrub/savanna. This is, probably because these forests may lack their own distinctive species and by the very nature of their floristic characters draw the species from deciduous and evergreen forests as well as attract generalists. The high alpha and beta diversity in the semievergreen forests was also to be expected in view of the possibilities of shared, widely distributed species.
The home garden butterfly assemblages had moderate species richness but the lowest beta diversity, i.e. they comprised of a relatively constant set of species. The gardens had considerable canopy heterogeneity and a variety of cultivated and naturalized plants, including several important nectar sources. They therefore attracted shade-loving forest species and open habitat dwelling butterflies alike, but had no exclusive species of their own, and hence turned out to be less cohesive. Highly ubiquitous species dominated the garden assemblages. Although the forest species also entered the home gardens, these were not very common. The ubiquity of garden species was therefore very high.
It must be noted however, that our sampling localities present transition zones from manmade ecosystems of coastal lowlands to forest and grasslands of the hills. The gardens and plantations that we have sampled represent assemblages enriched by species drawn from neighboring natural ecosystems. This may not be the case of villages or towns situated away from the forests and grasslands. Natural ecosystems located at more remote places in the mountains may also harbour more distinctive assemblages, in comparison with more human influenced ecosystems sampled for this investigation.
Monocultures of economic tree species–teak, rubber, arecanut, coconut, ailanthus and mahogany–harboured assemblages of low alpha diversity, moderate beta diversity and moderate levels of cohesiveness. These however, included species with highest ubiquity. Although plantations were similar to home gardens in some respects, they were much less distinctive than the latter, since their composition was determined much more by that of the neighbouring forests, while gardens shared species with other pools also, for instance, grasslands. This explains the higher beta diversity of the plantations than the home gardens.
Grasslands supported moderate alpha and low beta diversities, and lowest levels of abundance, ubiquity and cohesiveness. This suggests that they harboured a set of species specially adapted to these sunny, hot, dry and open vegetation types. However, due to some geographical species dissimilarity, their distinctiveness was moderate. Scrub/savanna constituted the other secondary vegetation type, but it differed from the grasslands in the vegetation structure and several diversity parameters. Thus, it supported lower levels of alpha and beta diversities but higher levels of species ubiquity and cohesiveness, besides least distinctive of all the communities.
Lastly, paddy fields supported butterflies at moderate densities, but lowest levels of alpha diversities and very low levels of beta diversities. These species exhibited moderate levels of ubiquity, very high levels of distinctiveness and very high cohesiveness value. This suggested that the paddy fields were inhabited by a set of more ubiquitous species adapted to open conditions.
Distinctiveness of species assemblages
A distinctiveness value of less than one implied that the species assemblages of that vegetation type differed more amongst each other when compared to assemblages belonging to other vegetation types. Semievergreen forests and scrub/savanna exemplify this in case of butterflies (Table 3). On the other hand, the values of distinctiveness measures were above one for all the vegetation types in case of trees and birds. There was nevertheless a reasonable degree of correspondence between tree, butterfly and bird communities, so that the distinctiveness values of a majority of bird and butterfly communities were above one for most vegetation types. The strategy of classifying the vegetation types based on the structural parameters, and not the floristic composition may then indeed provide a reasonable basis for organizing a sampling scheme for a programme of monitoring biodiversity.
Patterns of covariation
Tables 4 and 5 bring out notable contrasts and parallels in the patterns for tree, bird and butterfly diversities. Table 4 recasts the data in Table 3 after normalizing the values on a 0 to 100 scale, for each of the groups. This makes possible the inter-group comparisons by judging the values themselves which are now on a single, directly comparable scale. Consider the deciduous forests, for instance. They supported low levels of densities as well as alpha and beta tree diversities but moderate to high values of these attributes for the birds and butterflies. Their distinctiveness, on the other hand, is highest for the tree communities while moderate for birds and low for the butterflies. In terms of cohesiveness, the values for the bird communities were highest, that for the trees lowest, and moderate for butterflies. Bird species from deciduous forest assemblages were most ubiquitous, while trees and butterflies were least ubiquitous. Other vegetation types and assemblages also differed from one organism group to the other.
There were then no simple correlations of patterns of diversity from one taxonomic group to the other, across diversity parameters or vegetation types as indicated in Table 5. Out of the 18 correlations between these 3 groups on the basis of 6 diversity parameters, 15 were insignificant and only 3 were significant (p < 0.05). Because of limited sample size and spatial overlap, some of the patterns might have been obscured and need further investigations. Nevertheless, the investigations into these patterns across taxonomic groups were both interesting and exciting, as they provided newer insights for conservation planning. The lack of correlation or negative correlation between diversity levels or parameters across taxonomic groups was also reported at the scale of geographic regions24,25. Therefore, conservation prioritization based only on rare or charismatic mammal or bird species has certain limitations. However, our study questions the soundness of the hot spots approach based on analysis of single taxon, of prioritizing a few geographical areas or vegetation types for conservation based on the presumption that other taxonomic groups or diversity parameters26 are also well represented or correlated with the chosen taxon.
Prospects
These are rather preliminary results but we believe that they indicate directions along which we must work further to organize comprehensive programmes of monitoring biodiversity. Such a programme must follow a landscape perspective27 and not only investigate major environmental gradients, such as the gradient of increasing number of wet months as one progresses south on the Western Ghats. The patterns of diversity dispersion within a mosaic of landscape elements or vegetation types in a given locality must be explored. Further, it should encompass a broad range of representative types of organisms, not just flagship species or groups like large mammals15 and birds. Finally, a broad programme of biodiversity monitoring has to be based on a network approach as with the WGBN (ref. 13). It will be our endeavour to build upon these preliminary results and develop a sound programme of monitoring biodiversity in the Western Ghats region identified as one of the 18 biodiversity hotspots of the world13.
Lovejoy, T. E., in Biodiversity Measurement and Estimation, Chapman and Hall, London, 1995, pp. 81–87. UNEP-CBD, Convention on Biological Diversity (CBD), Secretariat on CBD, United Nations Environment Programme, Montreal, 1991. Gadgil, M., Curr. Sci., 1994, 66, 401–406. Daniels, R. J. R., Hegde, M., Joshi, N. V. and Gadgil, M., Conserv. Biol., 1992, 5, 464–475. Gadgil, M., Curr. Sci., 1996, 71, 688–697. Goldsmith, B. (ed.), Monitoring for Conservation and Ecology, Chapman and Hall, London, 1991. Noss, R., Conserv. Biol., 1990, 4, 355–364. Gadgil, M., J. Indian Inst. Sci., 1996, 76, 495–504. Pollard, E., Moss, D. and Yeats, T. J., J. Appl. Ecol., 1995, 32, 9–16. Daniels, R. J. R., Joshi, N. V. and Gadgil. M., Proc. Natl. Acad. Sci. USA, 1992, 89, 5311–5315. Harper, J. L. and Hawksworth, D. L., in Biodiversity Measurement and Estimation (ed. Hawkshworth, D. L.), Royal Society and Chapman and Hall, London, 1995. Utkarsh, G., Joshi, N. V. and Gadgil, M., Curr. Sci., 1998, 75, 594–603. Gadgil, M., Curr. Sci., 1996, 70, 36–44. Pramod, P., Joshi, N. V., Utkarsh, G. and Gadgil, M., Curr. Sci., 1997, 73, 122–127. Pearson, D. L., in Biodiversity Measurement and Estimation (ed. Hawskworth, D. L.), The Royal Society and Chapman and Hall, London, 1995, pp. 75–80. Gaokar, H., Butterflies of the Western Ghats, India; including Sri Lanka: Biodiversity Assessment of a Threatened Mountain System, Centre for Ecological Sciences, IISc, Bangalore and the Natural History Museum, London, 1996. Champion, H. G. and Seth, S. K., A Revised Survey of Forest Types in India and Burma, Manager of Publications, New Delhi, 1968. Pascal, J. P., Wet Evergreen Forests of the Western Ghats of India, Institut Francais, Pondicherry, 1988. Mueller-Dombois, D. and Elleinberg, H., Aims and Methods of Vegetation Ecology, John Wiley and Sons, New York, 1974. Wynter-Blyth, M. A., (Repr.). Butterflies of Indian Region, Today and Tomorrows Printers and Publishers, New Delhi, 1982. Evans, W. H., The Identification of Indian Butterflies, Bombay Natural History Society, 1932, 2nd edn., p. 454. Ludwig, J. A. and Raynolds, J. F., Statistical Ecology: A Primer on Methods and Computing, John Wiley and Sons, New York, 1988. Gauche, H. G. Jr., Multivariate Analysis in Community Ecology, Cambridge University Press, Cambridge, 1982. Prendergast, J. R., Quinn, R. M., Lawton, J. H., Eversham, B. C. and Gibbons, D. W., Nature, 1993, 365, 335–337. Gaston, K. J., in Aspects of Genesis and Maintenance of Biological Diversity (ed. Hochberg, M. K. et al.), Oxford University Press, 1996, pp. 220–242. Myers, N., Environmentalist, 1990, 10, 243–256. Forman, R. T. T. and Godron, M., Landscape Ecology, John Wiley and Sons, New York, 1987.
ACKNOWLEDGEMENT. We are grateful to all the members of the Western Ghat Biodiversity Network, for their local support. We are indebted to Prof. Madhav Gadgil and Dr N. V. Joshi for their support and encouragement. We thank the Ministry of Environment and Forest, Government of India and the local forest department officials for their continued co-operation. The PEW Foundation is acknowledged for providing flexible financial support.
Received 7 August 1997; revised accepted 14 June 1999